Dorset Police Use of Force: 2025/26
The use of force by police is one of the most scrutinised aspects of modern policing, balancing public safety with individual rights. Data published by Dorset Police for 2025/26 provides valuable insight into how, why, and against whom force is used across the county. This article examines the scale, patterns, and implications of these interactions.
Overall Scale of Use of Force
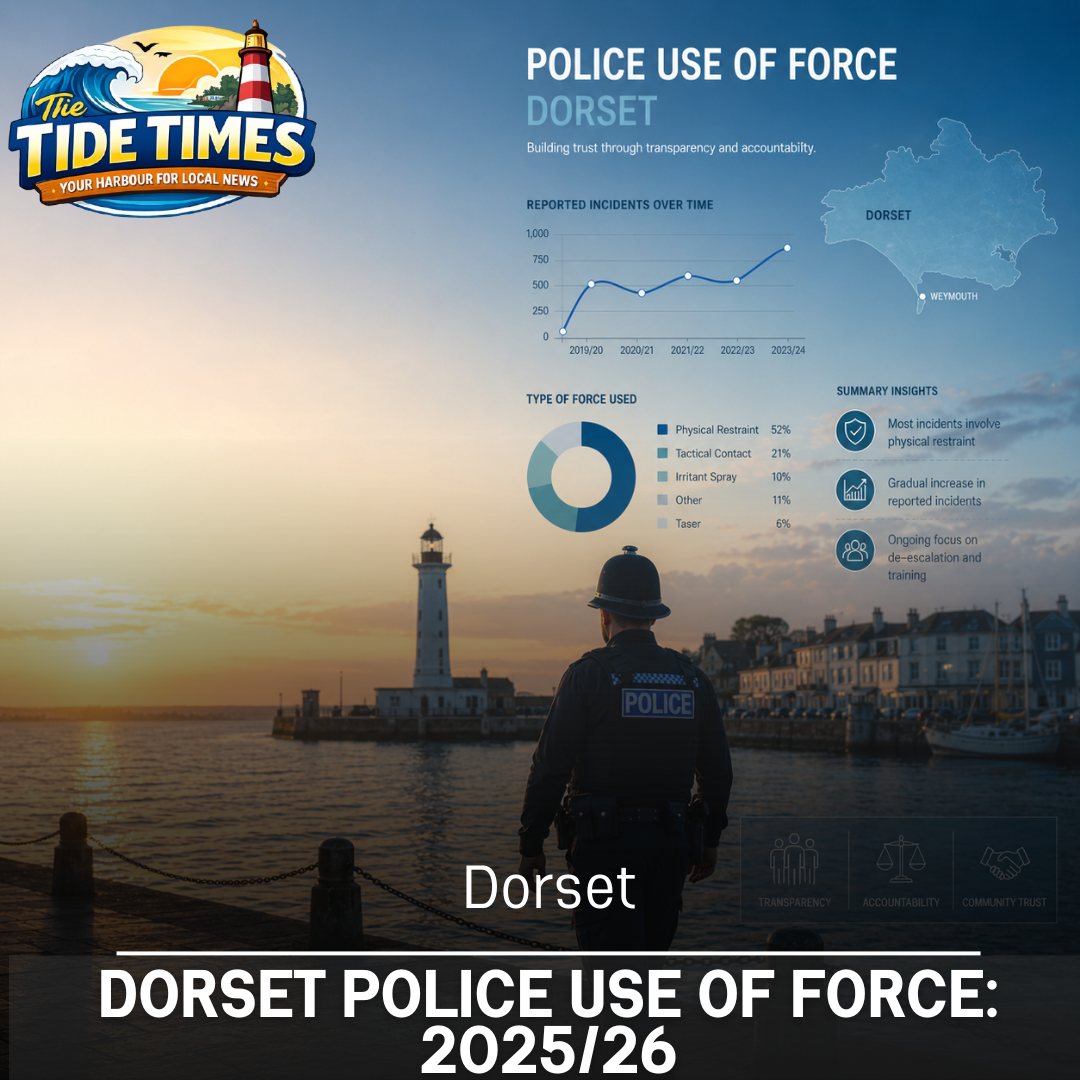
In the 2025/26 reporting period, Dorset Police recorded 6,801 use-of-force interactions, reflecting routine operational activity across the force area. (dorset.police.uk)
Quarterly distribution shows relatively consistent demand:
- Q1 (Apr–Jun 2025): 1,892
- Q2 (Jul–Sep 2025): 1,788
- Q3 (Oct–Dec 2025): 1,534
- Q4 (Jan–Mar 2025): 1,587 (dorset.police.uk)
A total of 2,785 individuals were subject to force, with 774 officers involved in at least one such interaction. (dorset.police.uk)
These figures suggest that use of force remains a regular but controlled component of frontline policing.
Primary Reasons for Use of Force
The majority of force is applied in response to lawful enforcement activity:
- Effecting an arrest – 51%
- Other operational reasons – 20%
- Preventing escape – 10%
- Search in custody – 6%
- Preventing offences – 2% (dorset.police.uk)
This distribution indicates that force is overwhelmingly tied to arrest and detention processes rather than proactive or discretionary use.
Tactics and Methods
Dorset Police primarily rely on lower-level, non-weapon tactics:
- Unarmed skills – 54%
- Compliant handcuffing – 29%
- Ground restraint – 23%
- Non-compliant handcuffing – 16%
- Other/improvised methods – 15% (dorset.police.uk)
The data highlights a strong emphasis on physical control techniques rather than higher-force options.
Taser Use
Taser deployment remains relatively limited and is often used as a deterrent:
- Red-dot (deterrent): 119
- Drawn: 51
- Aimed: 24
- Fired: 38
- Drive-stun: 0 (dorset.police.uk)
The high proportion of “red-dot” usage demonstrates that visibility alone frequently resolves incidents without discharge.
Geographic Distribution
Use of force is concentrated in urban areas:
- Bournemouth – 42%
- Weymouth and Portland – 18%
- Poole – 15% (dorset.police.uk)
This aligns with population density and nightlife-related policing demands.
Demographics: Age and Gender
- Male subjects – 79%
- Female subjects – 19% (dorset.police.uk)
Age distribution shows a strong concentration among younger adults:
- 18–34 years: 47.9%
- 35–49 years: 32.2% (dorset.police.uk)
This reflects broader national trends linking use of force to younger, higher-risk demographics.
Ethnicity and Disproportionality
Use of force by ethnicity:
- White: 84%
- Black: 6%
- Mixed: 4%
- Asian: 2%
- Other/Not stated: ~4% (dorset.police.uk)
However, disproportionality analysis shows higher likelihood ratios compared to White individuals:
- Black individuals: 9.91× more likely
- Mixed ethnicity: 2.12×
- Asian: 1.07× (dorset.police.uk)
It is important to note that Dorset Police emphasise these figures are relative to population representation, not raw totals. (dorset.police.uk)
Behavioral Drivers
The most common factors influencing use of force include:
- Alcohol involvement – 43%
- Drug use – 15%
- Mental health factors – 11%
- Prior intelligence/known risk – 9% (dorset.police.uk)
This highlights that force is frequently applied in complex, high-risk situations involving impairment or vulnerability.
Context and Public Scrutiny
Recent incidents and media coverage show that use of force remains a subject of public debate. For example, a large-scale public order incident in Dorset led to complaints about police tactics, demonstrating the importance of transparency and accountability in maintaining public trust.
Key Insights
1. Operational Necessity
Most use-of-force incidents are linked directly to arrests, indicating reactive rather than excessive application.
2. Low-Level Force Dominates
The reliance on unarmed tactics suggests a measured approach, with higher-force options used sparingly.
3. Disproportionality Remains a Concern
While overall numbers reflect population makeup, disproportionality ratios highlight an ongoing challenge in equitable policing.
4. Influence of Alcohol and Drugs
Substance use is a major driver, reinforcing the link between public disorder and force incidents.
5. Urban Concentration
Hotspots such as Bournemouth dominate use-of-force statistics, reflecting demand-led policing pressures.
The 2025/26 data from Dorset Police presents a picture of frequent but largely controlled use of force, primarily associated with arrests and public safety incidents. While the force demonstrates restraint through reliance on low-level tactics, issues such as ethnic disproportionality and public perception continue to require careful oversight.
Ultimately, effective policing in Dorset depends on maintaining the balance between necessary force and public confidence, supported by transparency, training, and ongoing scrutiny.